- Tools
-
 Bond Screener
-
 Watchlist
- Bonds
- Stocks
- ETF & Funds
- Indices
- News and Research
- Corporate Actions
-
 Excel Add-in
-
 API
API
- Get subscription

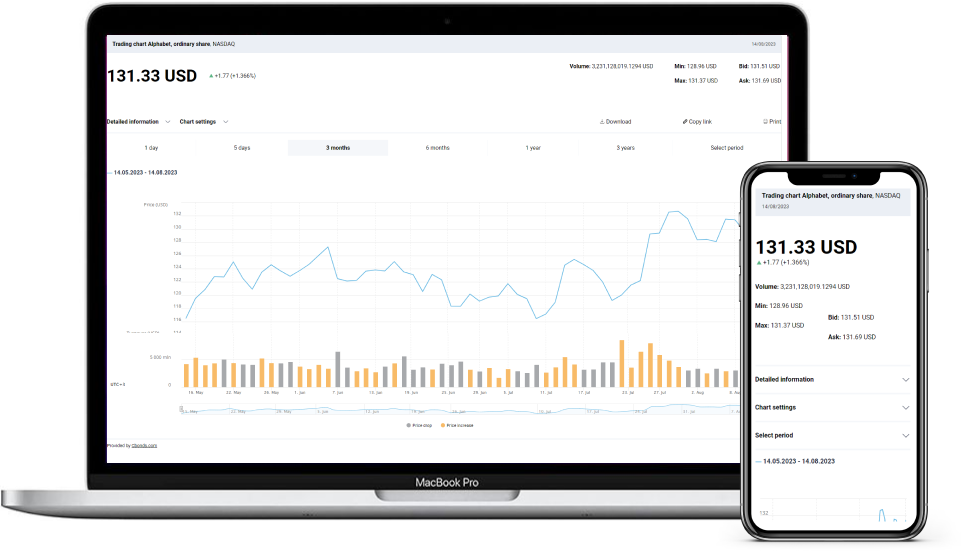
 Customize the widget according to your preferences
  widget@cbonds.info